Simulation
EDAcation allows you to run testbenches for your design files, which is the process of simulating your design to verify its functionality. The simulation task will take an active testbench file as input and produce a VCD file as output, which can be viewed directly in VSCode. The simulation task can be executed independently of the synthesis and place and route tasks, allowing you to test your design before synthesizing and placing it.
Support Matrix
The simulation task uses Icarus Verilog as backend. This backend is unfortunately not supported in a web environment.
| Feature | Windows (x64) | Linux (x64) | Linux (ARM) | MacOS (x64) | MacOS (Apple Silicon) | Web |
|---|---|---|---|---|---|---|
| Simulation | ✅️ | ✅️ | ✅️ | ✅️ | 🔶0 | ❌️1 |
| Waveform Viewer | ✅️ | ✅️ | ✅️ | ✅️ | ✅️ | ❌️2 |
0 Icarus Verilog is packaged and available on Apple Silicon Macs, but some people have reported issues with running it through EDAcation. Your mileage may vary. You can always install Icarus Verilog manually on your system, and EDAcation will use the system installation instead of the packaged one.
1 Icarus Verilog is not available as a WebAssembly package, and therefore cannot be used in a web environment.
2 EDAcation relies on surfer for waveform viewing. This extension is not available in a web environment.
Writing Testbenches
Testbenches are used to verify the functionality of your design by simulating its behavior under different conditions. EDAcation currently only supports writing testbenches in Verilog.
When writing a testbench, you should instantiate your design module and apply various input stimuli to it. You can use initial blocks in Verilog to define the sequence of events that will occur during the simulation. Additionally, you can use $dumpfile and $dumpvars in Verilog to generate a VCD file that records the simulation results.
In order for EDAcation to be able to detect the result of the simulation run, you should have a $dumpfile call in your testbench that writes to a file named <testbench_name>.vcd, where <testbench_name> is the name of your testbench file without the extension. For example, if your testbench file is named top_mac_tb.v, it should write to a file named top_mac_tb.vcd. EDAcation will then automatically detect this VCD file, add it to your project output files and display the waveform in the built-in viewer.
An example testbench can be seen below.
`timescale 1ns/1ps

module top_mac_tb;
    reg clk;
    reg rst;
    reg enable;
    reg signed [7:0] a, b;
    wire signed [7:0] out;

    // Instantiate the DUT (Device Under Test)
    top_mac uut (
        .clk(clk),
        .rst(rst),
        .enable(enable),
        .a(a),
        .b(b),
        .out(out)
    );

    // Generate clock
    always #5 clk = ~clk; // 10ns period (100MHz)

    initial begin
        // Initialize signals
        clk = 0;
        rst = 1;
        enable = 0;
        a = 0;
        b = 0;

        // Apply reset
        #20 rst = 0;

        // Test case 1: Basic operation
        #10 enable = 1; a = 8'd10; b = 8'd3;
        #10 a = -8'd5; b = 8'd4;
        #10 a = 8'd7; b = -8'd2;

        // Test case 2: Disable
        #10 enable = 0;
        #10 a = 8'd12; b = 8'd1;

        // End simulation
        #50 $finish;
    end

    // Dump waves for debugging
    initial begin
        $dumpfile("top_mac_tb.vcd");
        $dumpvars(0, top_mac_tb);
    end
endmodule
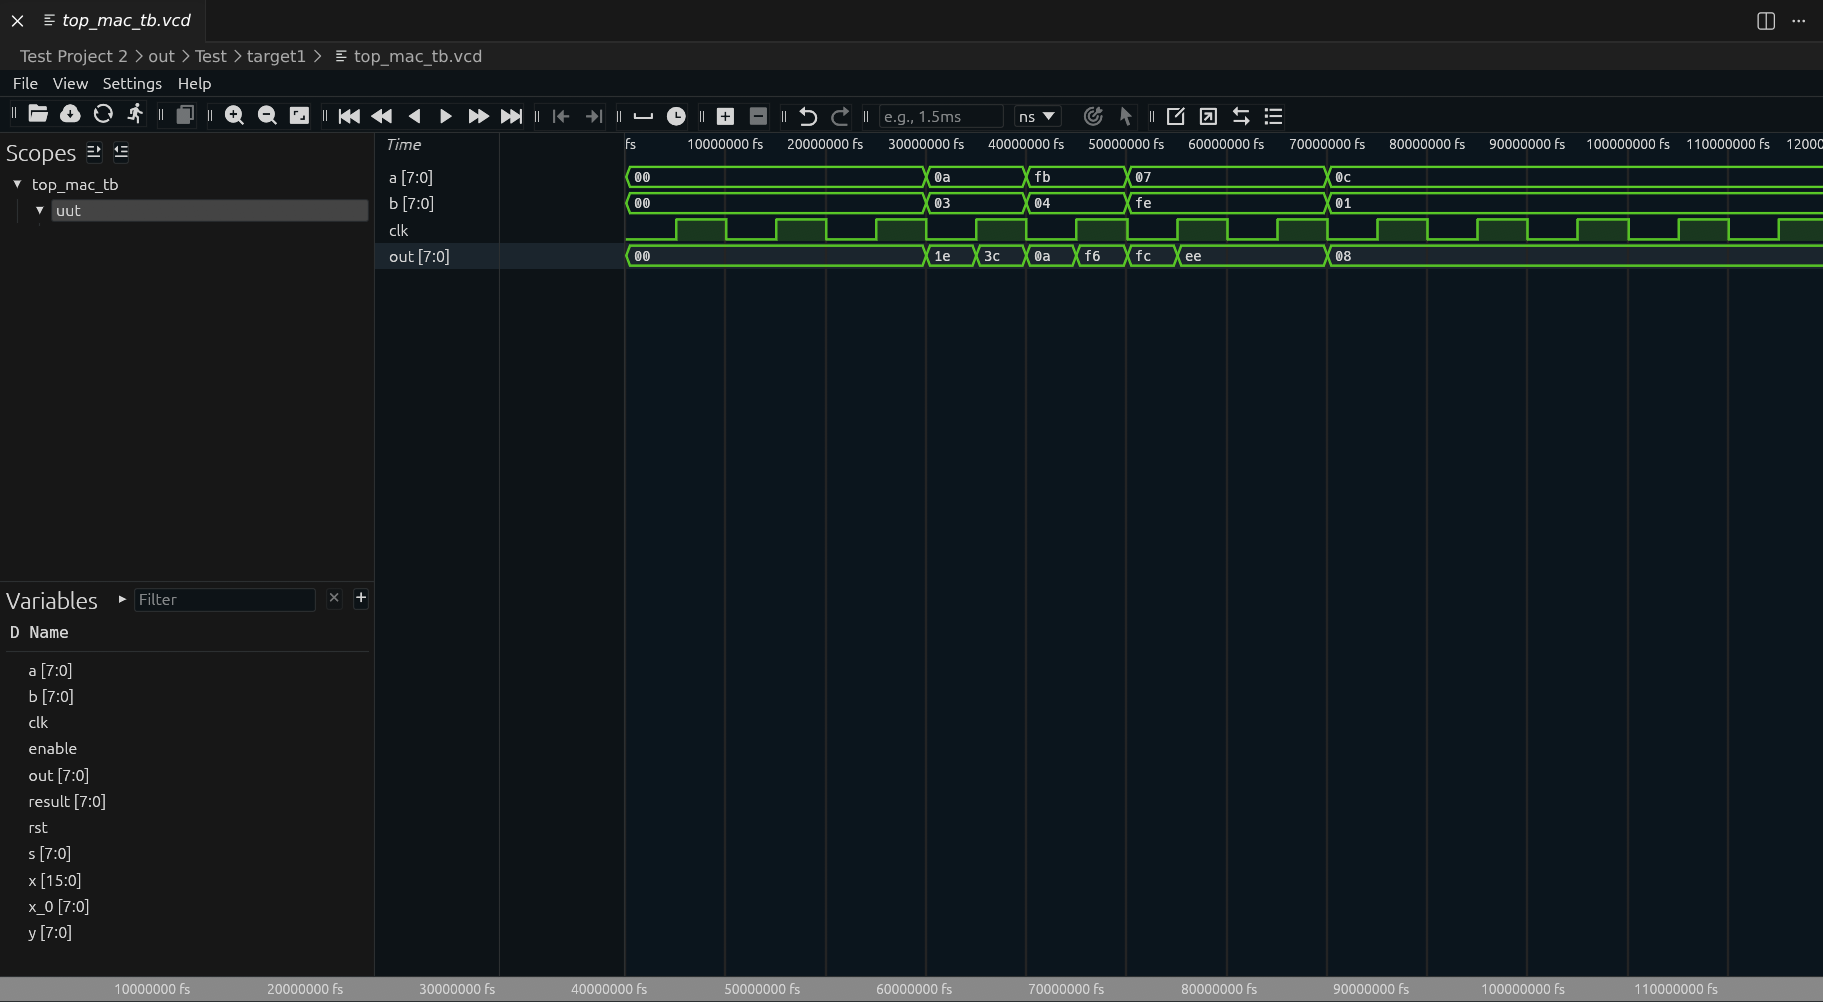
Value Change Dump (VCD) Viewer (<testbench_name>.vcd)
If the simulation was successful, it will result in a VCD file being generated. EDAcation relies on the third-party Surfer extension to provide a viewer for VCD files. You can explore the generated waveform directly in VSCode, and interact with the signals to see how your design behaves over time.