RTL
EDAcation allows you to generate RTL diagrams from your design files, which can help you visualize the structure of your design and understand how different modules are connected. The RTL generation task will take your design files as input and produce RTL files as output, which can be viewed directly in VSCode or with third-party applications.
Support Matrix
The RTL generation feature uses Yosys as backend. This backend is supported on all platforms.
When working with VHDL designs, EDAcation uses GHDL as a preprocessor in combination with ghdl-yosys-plugin. These tools have limited platform support, which is reflected in the support matrix below.
| Feature | Windows (x64) | Linux (x64) | Linux (ARM) | MacOS (x64) | MacOS (Apple Silicon) | Web |
|---|---|---|---|---|---|---|
| RTL Generation - (System)Verilog | ✅️ | ✅️ | ✅️ | ✅️ | ✅️ | ✅️ |
| RTL Generation - VHDL | ✅️ | ✅️ | ✅️ | ❌️0 | ✅️ | ❌️0 |
| RTL Diagram Viewer | ✅️ | ✅️ | ✅️ | ✅️ | ✅️ | ✅️ |
| RTL Statistics Viewer | ✅️ | ✅️ | ✅️ | ✅️ | ✅️ | ✅️ |
0 The GHDL + ghdl-yosys-plugin combination is not supported on Intel-based Macs (x64). There is also no WebAssembly version of GHDL, meaning that it cannot be used in a web environment.
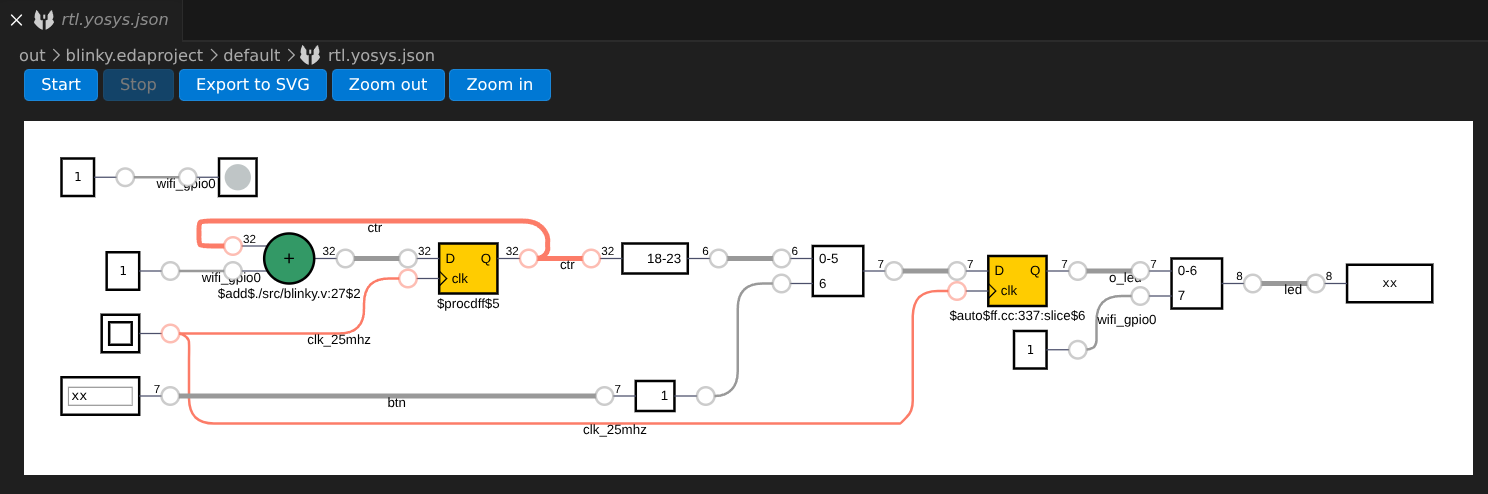
RTL Diagram (rtl.yosys.json)
The RTL generation task produces an output file named rtl.yosys.json. EDAcation provides a built-in viewer for this file powered by DigitalJS. You can explore the generated RTL diagram directly in VSCode, and interact with the modules to see how your design behaves. Click the 'start' button in the top left corner to start the simulation.
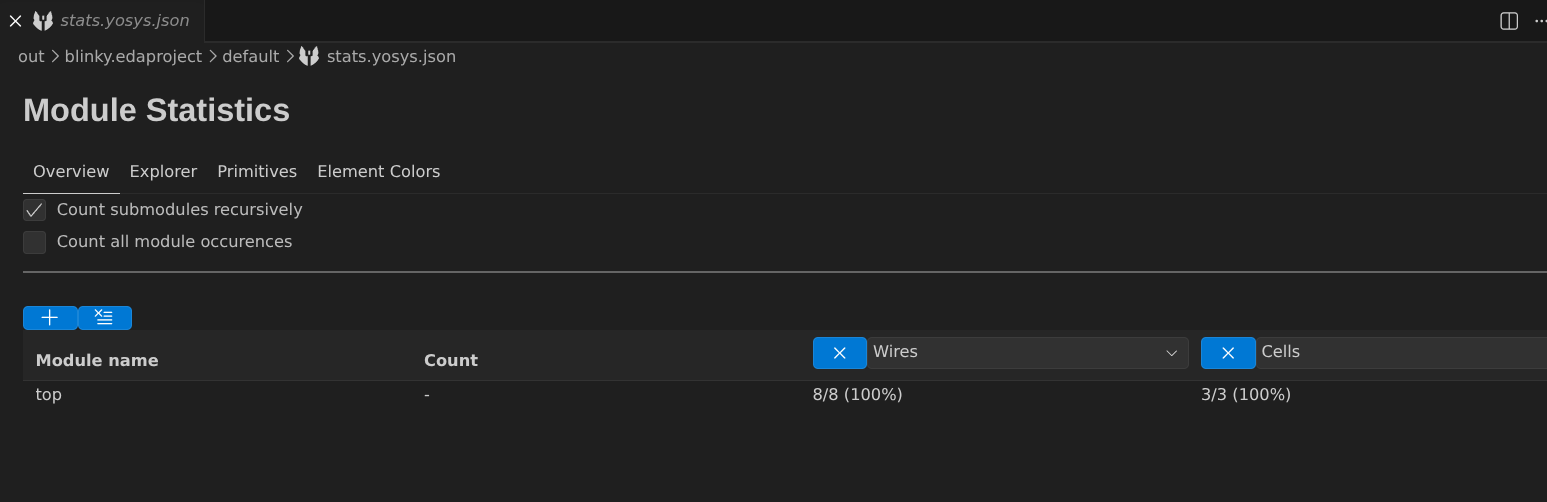
Statistics (stats.yosys.json)
The RTL generation task also produces a stats.yosys.json file, which contains various statistics about your design, such as the number of cells, wires, and more. EDAcation provides a custom built-in viewer for this file, which allows you to easily explore the statistics of your design in a structured way.